In this lab you will use JMX to monitor a running application
remotely. You will use the RepositoryPerformanceMonitor to collect
performance metrics and expose them via JMX.
Specific subjects you will gain experience with:
What you will learn:
@ManagedResource, @ManagedAttribute,
@ManagedOperation@EnableMBeanExportEstimated time to complete: 30 mins
Quick instructions for this exercise have been embedded within
the lab materials in the form of TODO comments. To display them,
open the Tasks view (Window >>
Show View >> Tasks (not Task
List)).
(TODO 01) This is already a
complete, working application. Run it now by right-clicking on the
project and selecting Run As …
> Run Spring Boot App. Open a browser window to http://localhost:8080 to see the usual home
page.
Once you are happy the application is working, you can stop it so we can modify the code.
Find and open the JamonMonitorFactory class in the rewards.internal.monitor.jamon package.
Notice that this is an implementation of the MonitorFactory
interface that uses the JAMon library to accomplish it’s
performance monitoring.
When you are comfortable with the implementation of this class, move on to the next step where you export an instance of this bean via JMX
(TODO 02) Add Spring’s JMX
annotations @ManagedResource, @ManagedAttribute and @ManagedOperation to the class as well as
methods you want to expose via JMX. Use statistics:name=monitorFactory as name for
the bean exposed.
By placing the data collection and exposure of performance
metrics in the JamonMonitorFactory
class, we’ve ensured that the RepositoryMonitorFactory is completely
decoupled from any reporting mechanism. The MonitorFactory interface is very generic,
but allows each implementation strategy to expose any data it sees
fit.
When you have finished exporting the JamonMonitorFactory class to JMX, move on
the next step
(TODO 03) Find and open the AspectsConfig class in the config package. In this file activate
annotation driven JMX by adding the appropriate annotation.
In this step, you will deploy the project as a Spring Boot
application. However, before you can do that, you must tell the
Java VM to start an MBeanServer.
IMPORTANT STEP:
(TODO 04) To start our MBeanServer, open the Window menu, go to
"Preferences…", then select "Java > Installed
JREs" on the left. Select "Edit…" for the JRE that
you are using and add -Dcom.sun.management.jmxremote as a VM
argument. This value instructs the JVM to start the internal MBeanServer and also allows connections to
it via shared memory, so that when you run JConsole it will see the process and allow
you to directly connect to it, instead of needing to use a socket
connection, with a name/password required.
(TODO 05) Now deploy the project as
a web application. Once deployed, open http://localhost:8080 in your browser. You should
see the welcome page display containing a link to submit a new
reward.
(TODO 06) From the command line of
your system, or Windows Explorer, run the $JDK_HOME/bin/JConsole application. When
this application starts up, choose the process that identifies your
web application and open it.
![[Tip]](images/tip.png) |
Tip |
|---|---|
|
If you can not see the process you started, in -Dcom.sun.management.jmxremote.port=8181 -Dcom.sun.management.jmxremote.authenticate=false -Dcom.sun.management.jmxremote.ssl=false Then restart the process, and connect via |
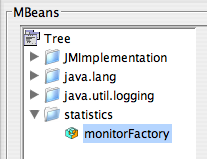
Once connected to the application, navigate to the MBeans tab and find the MBean you
exported.
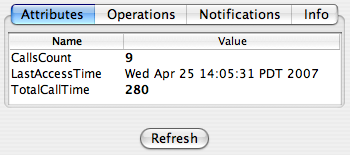
Once you have found the MBean, execute a few rewards operations in the browser and refresh the MBean attributes. You should see something similar to this
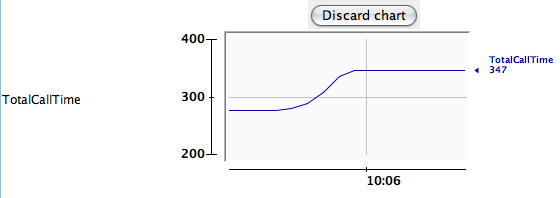
![[Note]](images/note.png) |
Note |
|---|---|
|
Double clicking on any scalar value will create a graph over time |
Explore the attributes and operations of the MBean and when you are finished move to the next section
Spring Boot applications export a predefined MBean that gives you the ability, via JMX to monitor and interact with your application (it offers similar functionality to the Actuator endpoints).
In JConsole you should see the "org.springframework.boot" MBean. Open it up and explore what you find. For example, you should be able to
application.propertiesOnce you have completed this step, you have completed the lab.